-
Marcus Ulrich
Projects
- MMI Slideshow
- OCR Panel and ClusterManager
-
My Background
Why am I a programmer?
- I like building things with language and imagining new processes and interfaces.
Education: UC Davis and San Jose State University
- At San Jose State, I studied Economics and Journalism and won a national award from Columbia University for my news writing.
- At UC Davis, I majored in Math because it was my weakest subject. I struggled at first, but graduated with high grades in all my classes. I received a B.S. in Math with minors in Computer Science and Economics.
Training: The Orange County Register
- I started out posting the newspaper stories to the web site.
- I wrote a Python script to scrape the site and gather statistics so I could better understand how the people with more experience placed stories and rewrote headlines.
- Mashups were big at the time (chicagocrime.com, etc), so I decided to put the data I was gathering on a Google Map. People liked it and eventually I was asked to spend more time working on Google Maps.
- I built the (Orange County Register) OCR Panel and ClusterManager to help manage our maps functionality.
- I also worked on various smaller projects such as displaying election results and streamlining voting in the Best of Orange County contest.
Perspective: Spain and Euskadi (The Basque Country)
- I wanted to take a few years to do things completely differently.
- Program in different languages: Objective C and Java
- Speak in different languages and understand different cultures: Spanish, Basque, and French
- Use a different world interface: Roundabouts, public transit (I'm a Californian), light switches you tap instead of flip and countless other little details.
- Also I wanted to ride a motorcycle through the Alps.
Now
- Studying Machine Learning and a few other things with Coursera.
- Writing MMI Slideshow so I have an easier way to manage my photos without giving them to Facebook/Flickr/Instagram/etc.
- Various side projects.
-
MMI Slideshow - Goals
Why?
- I like writing software I use. This slideshow is an MMI Slideshow.
- Half the Internet is slideshows: Facebook, Twitter, Flickr, Instagram, every media website ...
- The other half is web apps with images that could probably be better managed.
- Act as a polyfill for HTML5 picture element behavior and think about the back end issues for generating it.
Front End
- Configurable, lazy loading of all
imagescontent with a data-src attribute. - Optional thumbnails from a sprite. Thanks to HTTP/2, this might be a bad design decision in the future: http://http2-explained.readthedocs.org/en/latest/src/http2world.html
- Infinite image loading with JSON.
- Usual JavaScript slideshow stuff:
- Pagination, captions, credits, transitions, responsive, swipes and keyboard input, page numbering, play/pause button, show and hide navigation and captions ... and tests!
Back End
- Create slideshow automatically from a directory of images.
- Load photos and photo meta-data from a photos.json file.
- Create thumbnail sprite.png automatically.
-
MMI Slideshow - Testing, Building, and Code
Example Configuration HTML
-
MMI Slideshow - Examples
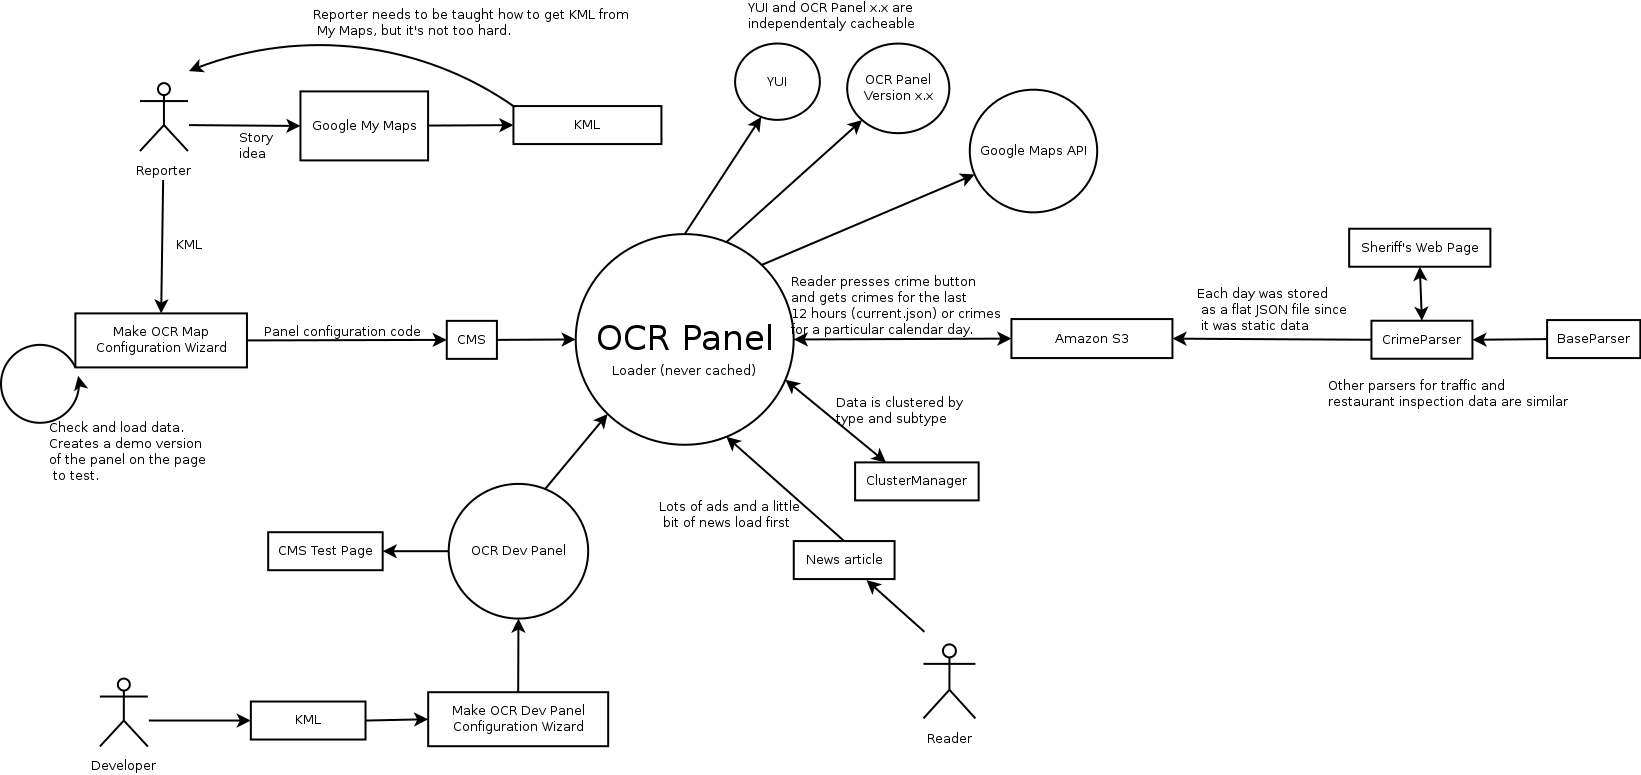
-
OCR Panel and ClusterManager
Goals
- Fast and easy for reporters to create.
- Lazy loading: The panel loads after the rest of the page.
- Centralized: A loader file that's never cached points to the newest files that may be cached.
- Resizeable since maps are often sidebar elements of a story.
- Newspapers exist because of reporters. This should be a tool that makes it easy for reporters to add to data. For example, if there's a fire, reporters can add value by layering story details on top of automated data like a weather KML layer from NOAA.
-
OCR Panel - System
Example Configuration HTML
-
OCR Panel Example
This is a re-creation using Google Maps API V3. The original was built with Google Maps API V2 and integrated custom traffic, restaurant inspection, and real estate data in addition to the crime data. Each panel also had an associated datatable that could be shown or hidden.
Use the "More..." button to see crime markers.
Loading... -
OCR Panel - Challenges
- Loading the right things at the right time in the right order.
- Making sure my CSS doesn't get trampled. Making sure my CSS doesn't trample anything else.
- Extensibility: An OCR Panel can create subpanels of diffent types and attached to different map buttons. Each subpanel can create a datatable extended from a base class. Markers of different types are attached to one marker manager instance.
- Too many markers. Clustering!
-
ClusterManager Design Options
- Explicitly clustering: K-means, distance.
- Image-mapped images
- Grid-based clustering
- Store markers in a hash.
-
Distance-based clustering
For each marker you look at each cluster to see how far it is from the center of the cluster. If the distance is less than a maximum (user specified) distance and the cluster is the closest, then that marker is added to the cluster. If the marker fails to be added to any cluster then a new cluster is created containing that marker.
Image and text from https://developers.google.com/maps/articles/toomanymarkers
- Good: Very accurate.
- Bad: Not fast. O(n^2) if you compare every point to every other point.
-
Image-mapped images
Basically, not clustering. Take the image below, overlay it on the map, and map out regions to click event handlers.
Example tile overlay:
- Good: This is what Google does!
- Great: O(1), at least on the front end.
- Bad: Requires a dedicated image server and an algorithm that can take arbitrary data and turn it into images and image maps.
-
Grid-based clustering
Grid-based clustering works by dividing the map into squares of a certain size (the size changes at each zoom) and then grouping the markers into each grid square.
This technique can be rather quick because it only requires iterating through the markers once to see if its position is between a set of coordinates; no complicated distance calculation is needed. It does have some limitations, as you can see marker's 7 and 8 are close together but because they are in separate grids they are not clustered together.
Image and text from https://developers.google.com/maps/articles/toomanymarkers
- Good: Pretty fast. O(n)
- Bad: Not very accurate. Really just de-cluttering.
- Bad: I couldn't figure out a simple way to set up the grid.
- Grid-box based: Divide the viewport into a grid and then for each grid box check each unclustered marker to see if it's inside. Cluster boxes and their markers as they enter the viewport. Redo all the clusters if markers are added or removed.
- Marker based: For each marker, figure out its grid box. Or ... (see next slide)
-
Store markers in a hash
There may be more accurate algorithms for getting a geohash (http://en.wikipedia.org/wiki/Geohash) since latitude and longitude are angles, but I wanted something simple so I just turned the latitude and longitude into a long binary number and truncated digits for granularity. Also, I developed my algorithm before geohash.org was announced.
See the Pen WbLQjQ by Marcus Ulrich (@mallocs) on CodePen.
To test it, I wrote a boxToPolygon function. I could then take a marker fixture, get its geohash, get the region for the geohash, put both on a map and make sure the marker was inside the region. Doing this made me realize how common edge cases were (markers near the grid border), so I updated the clusterer to do optional distance-based clustering with neighboring boxes.
- Good: Pretty fast. O(n).
- Good: Simple
- Good: Easy to invert to get a region from a geohash.
- Bad: Not very accurate. Really just de-cluttering.
-
ClusterManager Example
-
How does ClusterManager compare?
-
Why Marcus?
- I've designed a complete, albeit simple, web app.
- And a few incomplete ones on my own time
- I'm sort of obsessive about UI.
- I love and am pretty good at approaching problems from a novel angle.
- But I don't mind a tried and true approach if it really is best.
- I eat my own dog food.
- I'm not afraid to fail,
- but I am afraid of not finishing.
-
100 Cups of Coffee in 2 Days
I tried to go to 100 different coffee places around Orange County in 2 days and drink 1 cup of coffee at each of them and put it all one of my maps in real time. I failed to drink all the coffee, but I learned how to push my web app even further by using it to do live reporting.
Loading...